What it does
An instrument first, and a record keeper second.
Measurements you can quote
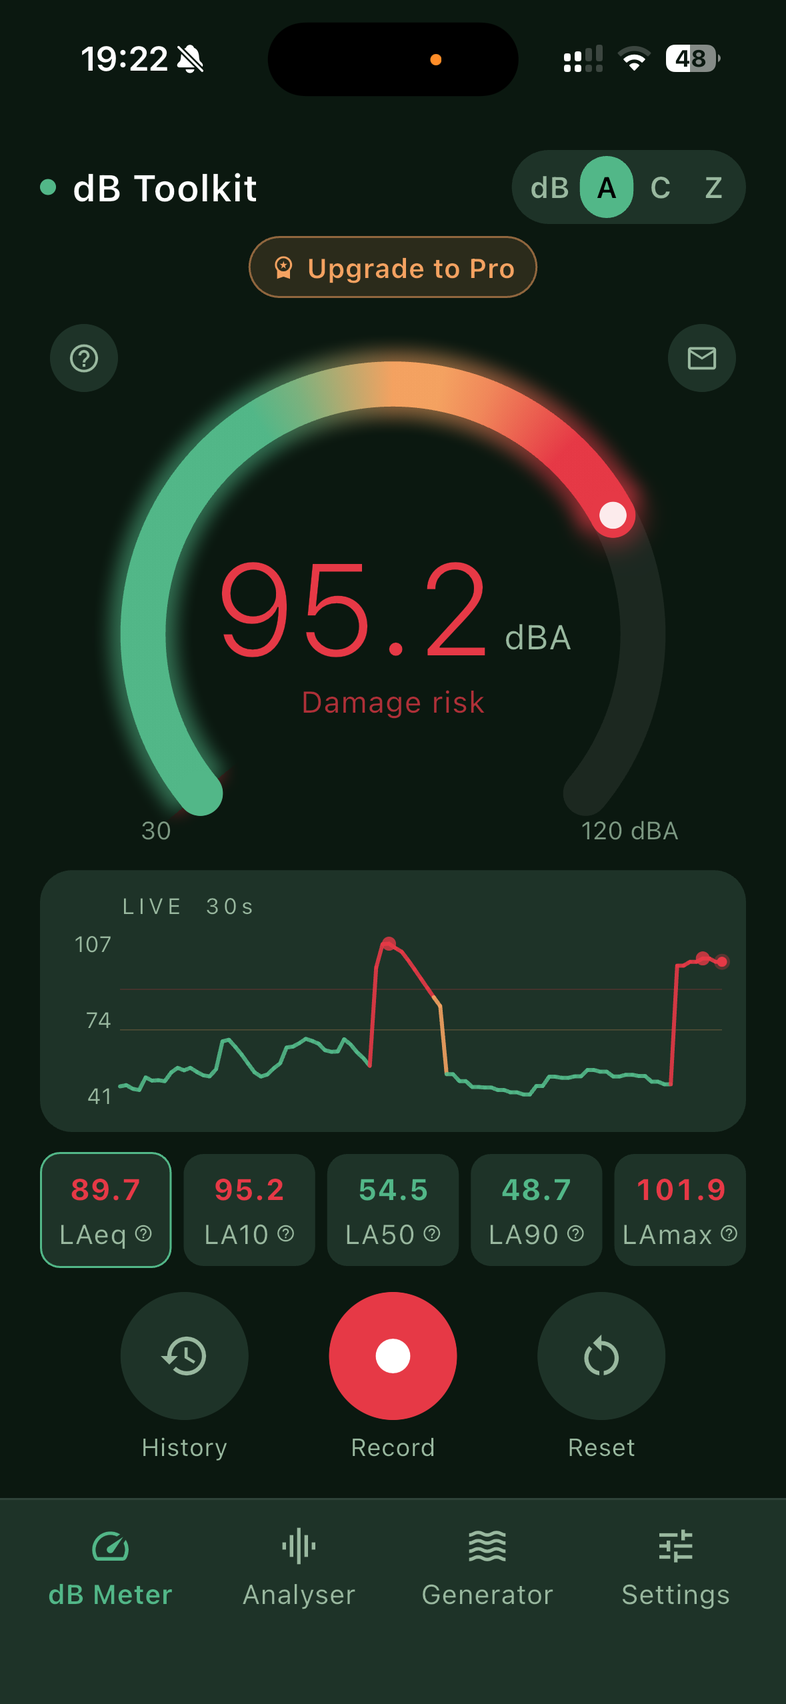
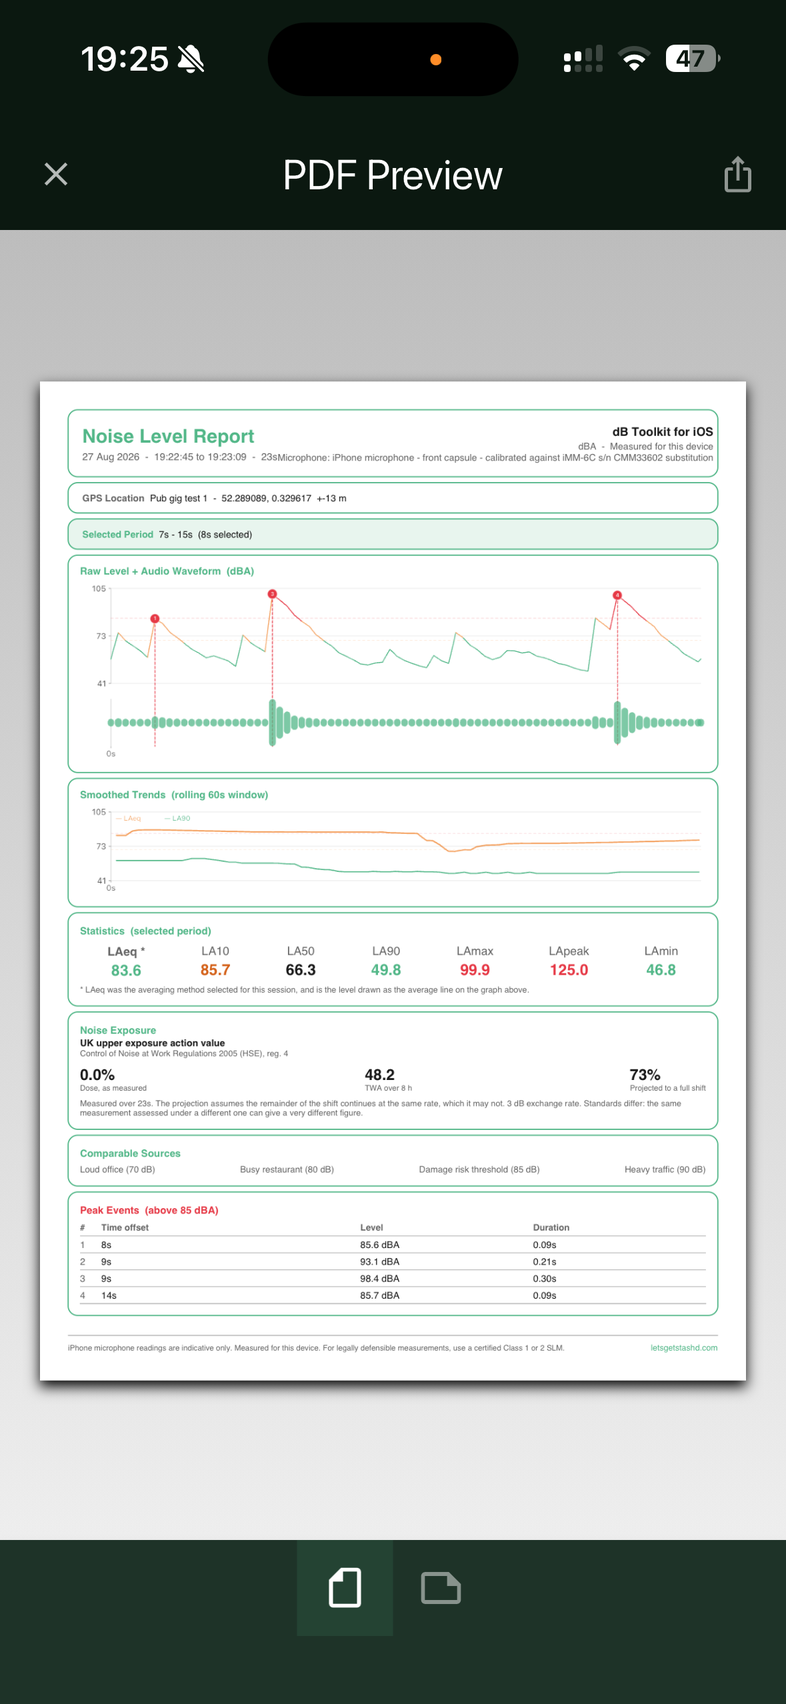
dBA, dBC and dBZ as real IEC 61672-1 filters, not labels. Fast, Slow and Impulse time weighting. LAeq, LA10, LA50, LA90, LAmax and Lpeak.
Honest about accuracy
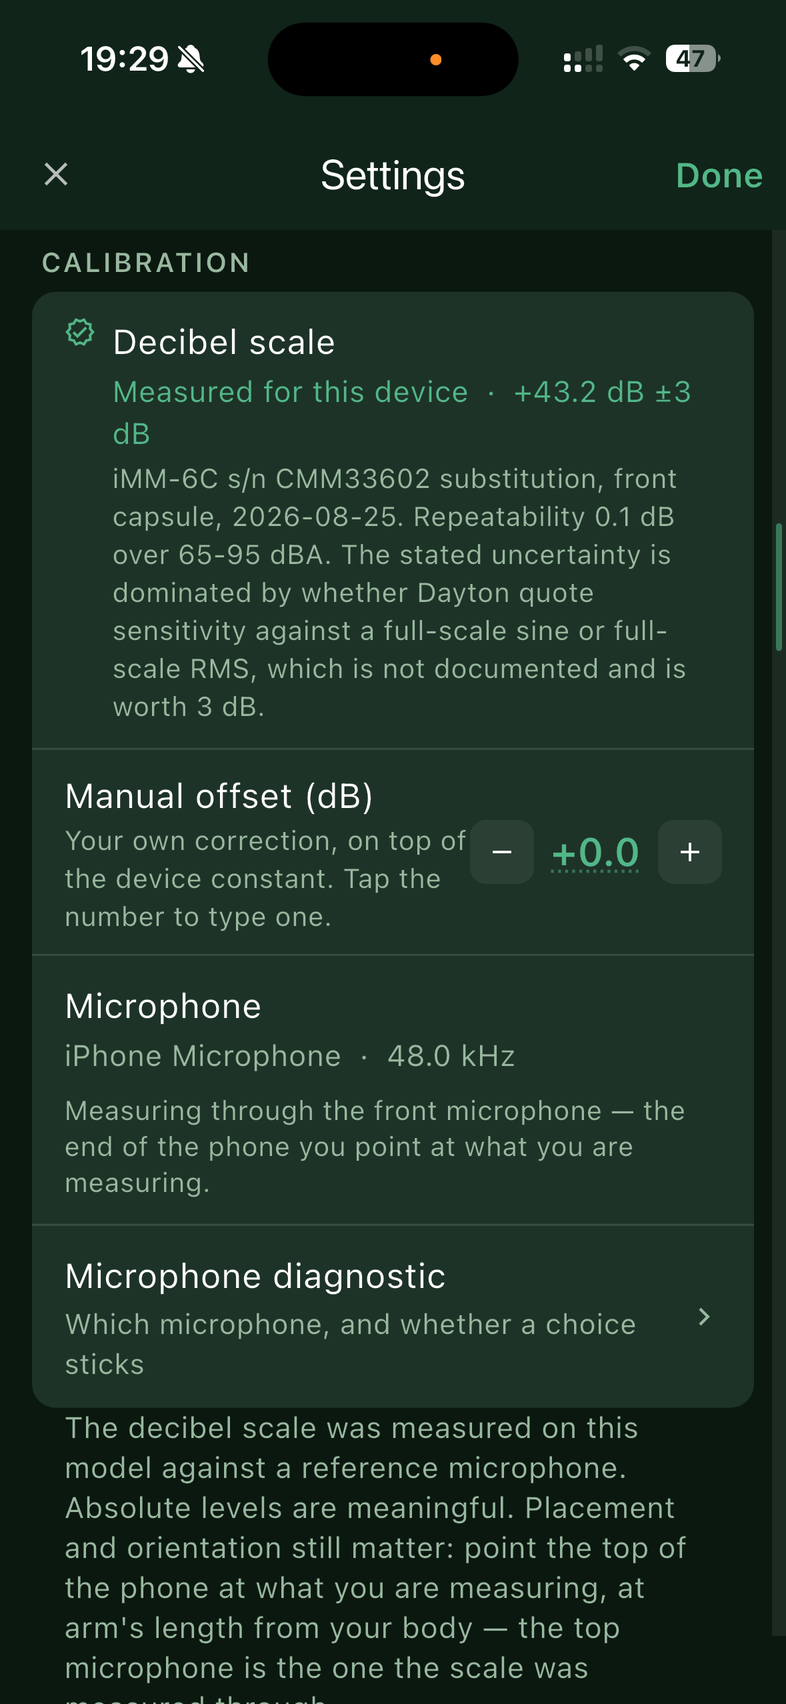
iPhones do not publish a microphone sensitivity, so most sound level apps show a number referenced to nothing at all. This one ships a constant measured against a calibrated reference microphone, and states its uncertainty on every report.
The record
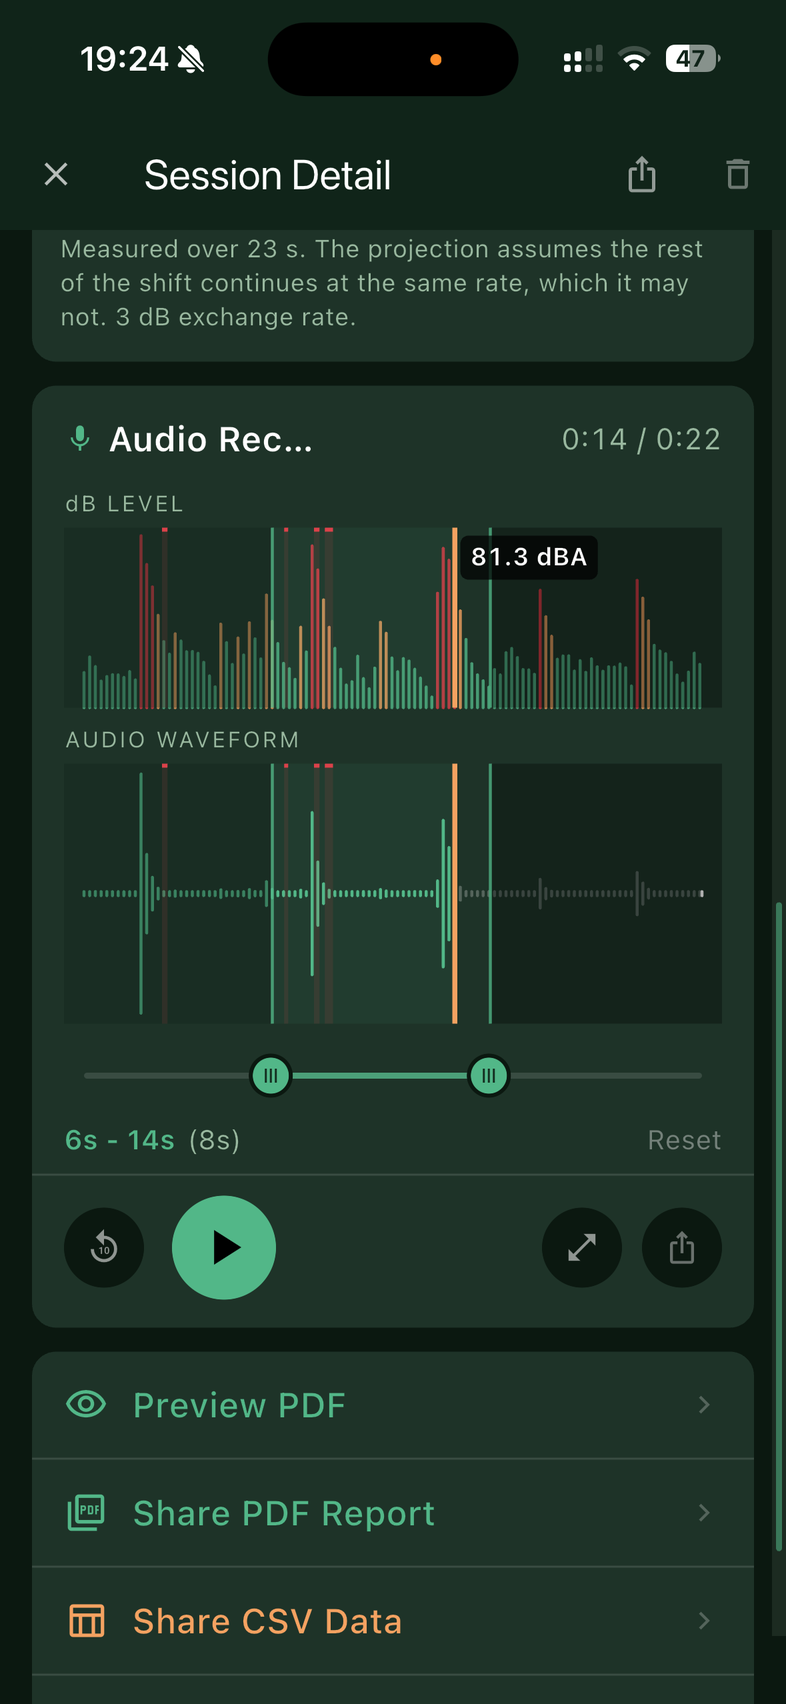
Record a session of any length — it keeps measuring with the screen locked. The audio is saved too, and every interruption is stated in the report, because a gap nobody mentions is worse than no measurement.
Measured against a standard
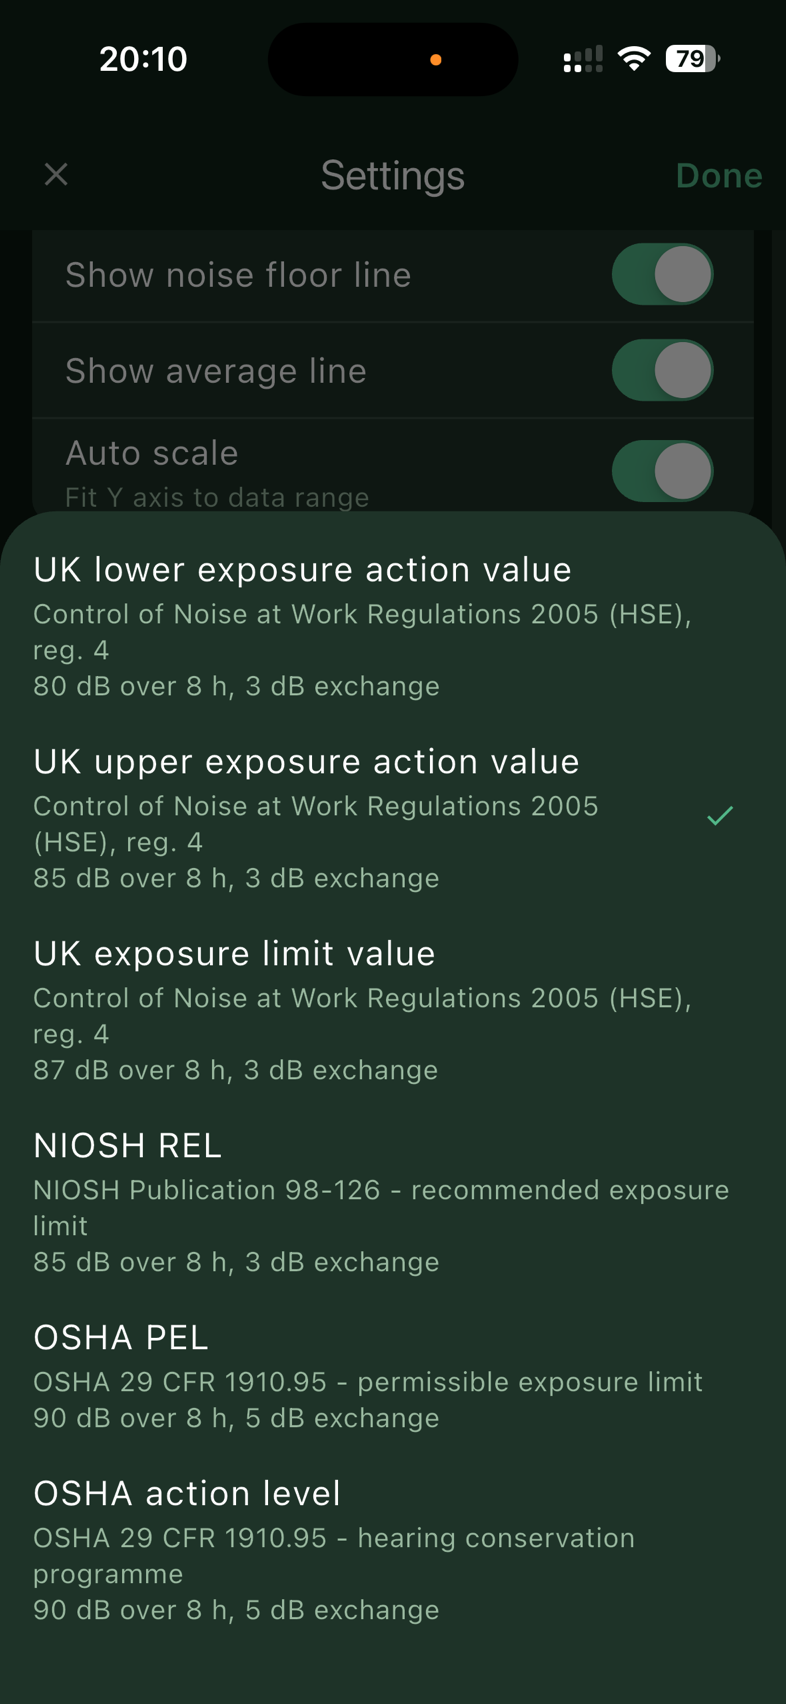
Pick a published limit — the Control of Noise at Work Regulations 2005, BS 4142, BS 8233, OSHA or NIOSH — and get a verdict in the report, with the source document named.
Noise exposure
Cumulative dose while you record and in the report, against the standard you choose. OSHA and NIOSH can differ enormously on the same day of noise — eight hours at 95 dB(A) is 200% of the OSHA permissible dose and about 1008% of the NIOSH one — so the app always names which one it used.
Analyser and generator
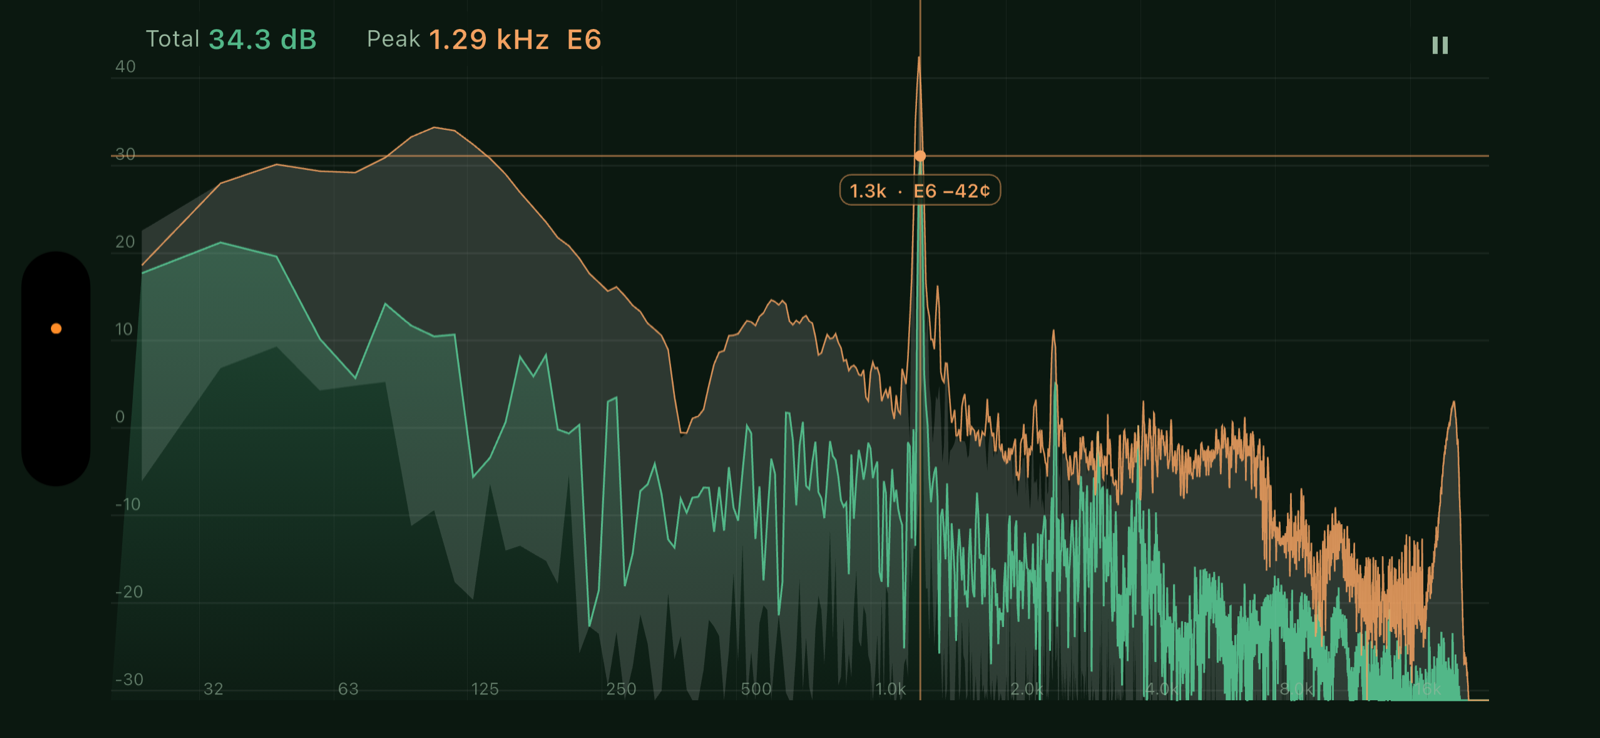
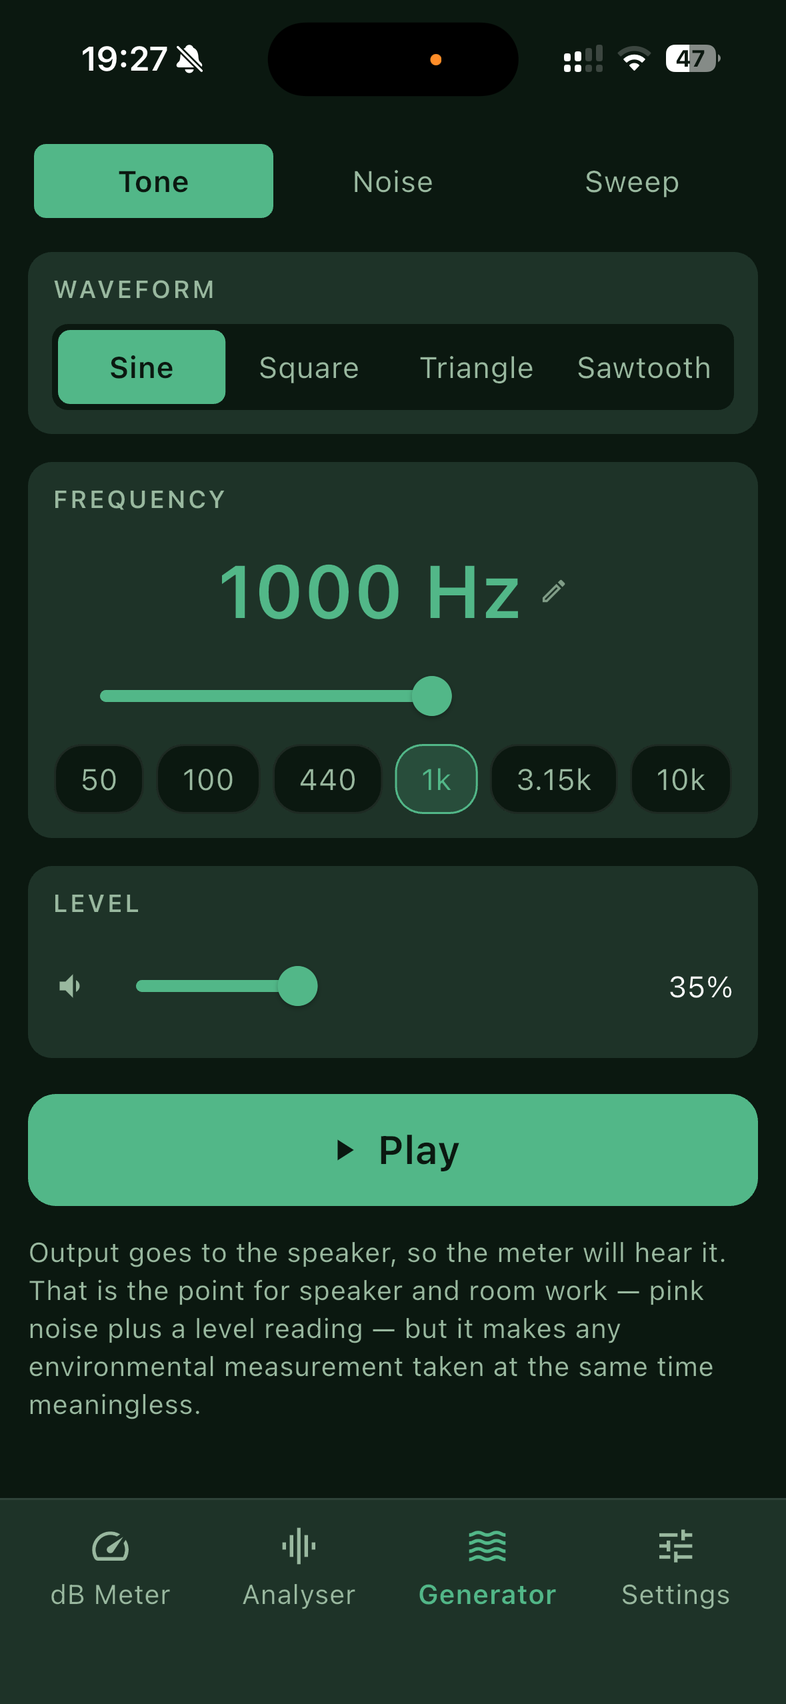
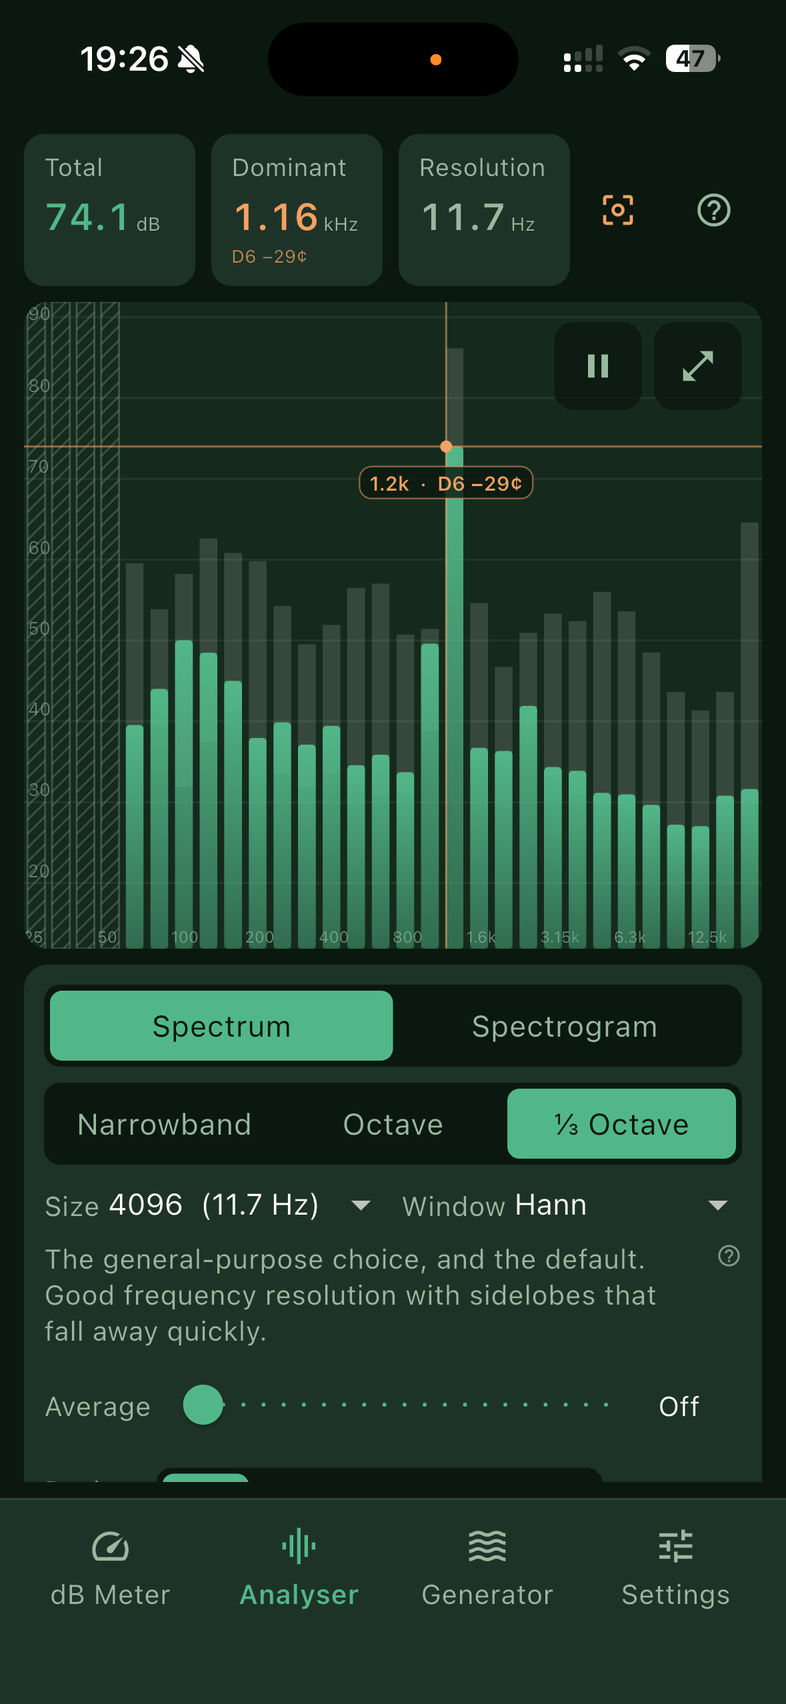
A real-time spectrum analyser — narrowband, octave and third-octave, with averaging, peak hold and a min/max envelope — and a signal generator with tones, white, pink and brown noise, and sweeps.
The spectrogram
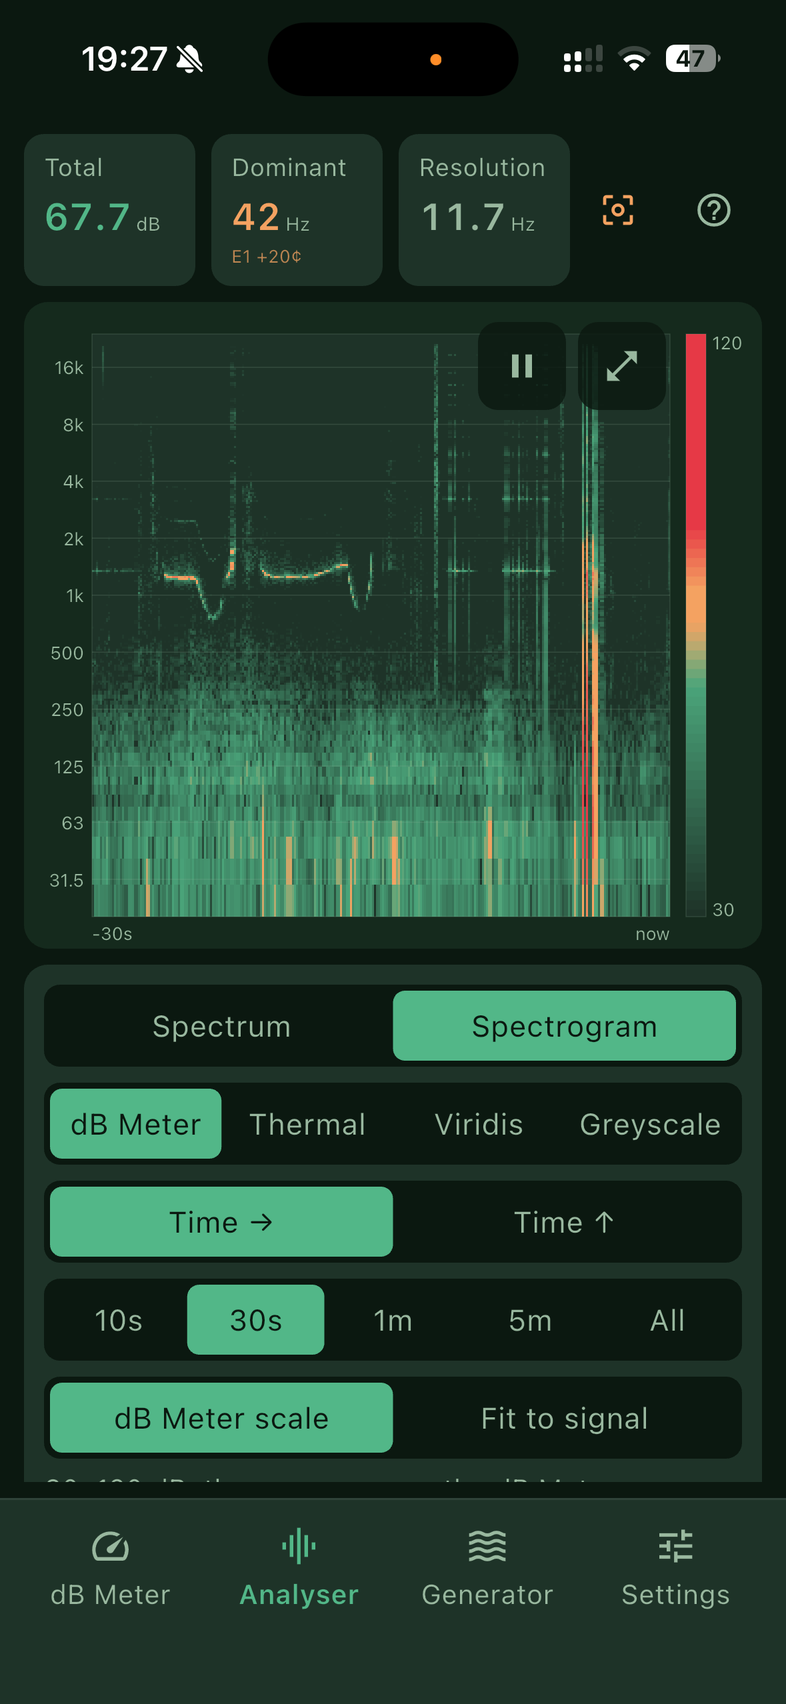
The spectrum over time, so you can see when a noise started and how long it lasted rather than only what it is made of now. Feedback building before it rings is a line thickening; a room mode is a horizontal stripe; a neighbour’s bass is a band that starts and stops.
Room measurement
Play a sweep, record it back, and get the reverberation time per octave band, the clarity figures and the arrival time. Where a band’s decay disappears into the noise it returns nothing rather than inventing a figure, and says so.
Bring your own measurement microphone
A calibrated USB microphone on an iPhone is a genuinely better instrument than an iPhone, and very little on iOS supports one properly. dB Toolkit does. Plug in a Dayton Audio iMM‑6C, a miniDSP UMIK‑1 or a miniDSP UMIK‑2, enter its sensitivity or import its calibration file, and the app measures through it properly — on that microphone’s scale, not the phone’s.
Two things it will not do. It will never quietly add the reference microphone’s sensitivity to the phone’s own constant — that double‑counts by about 30 dB, and a silent room would read like a loud one, plausibly. And an attached microphone the app knows nothing about is flagged amber rather than trusted: its reading looks exactly as authoritative as any other and is referenced to a scale nothing else shares.
Read the per‑serial calibration file, not the datasheet. The bench iMM‑6C here measures 1.3 dB from its published model figure, and a constant taken from the spec sheet would have been wrong by that much while looking measured to everyone who read it afterwards.
Measurement microphone support is part of Pro. The phone’s own path stays fully calibrated and free — that is not negotiable. Somebody recording a neighbour at 2 am has a phone and nothing else, and if the honest answer to “is this accurate?” were ever “buy a microphone”, the app would have failed at the thing it exists for.
What costs money, and what does not
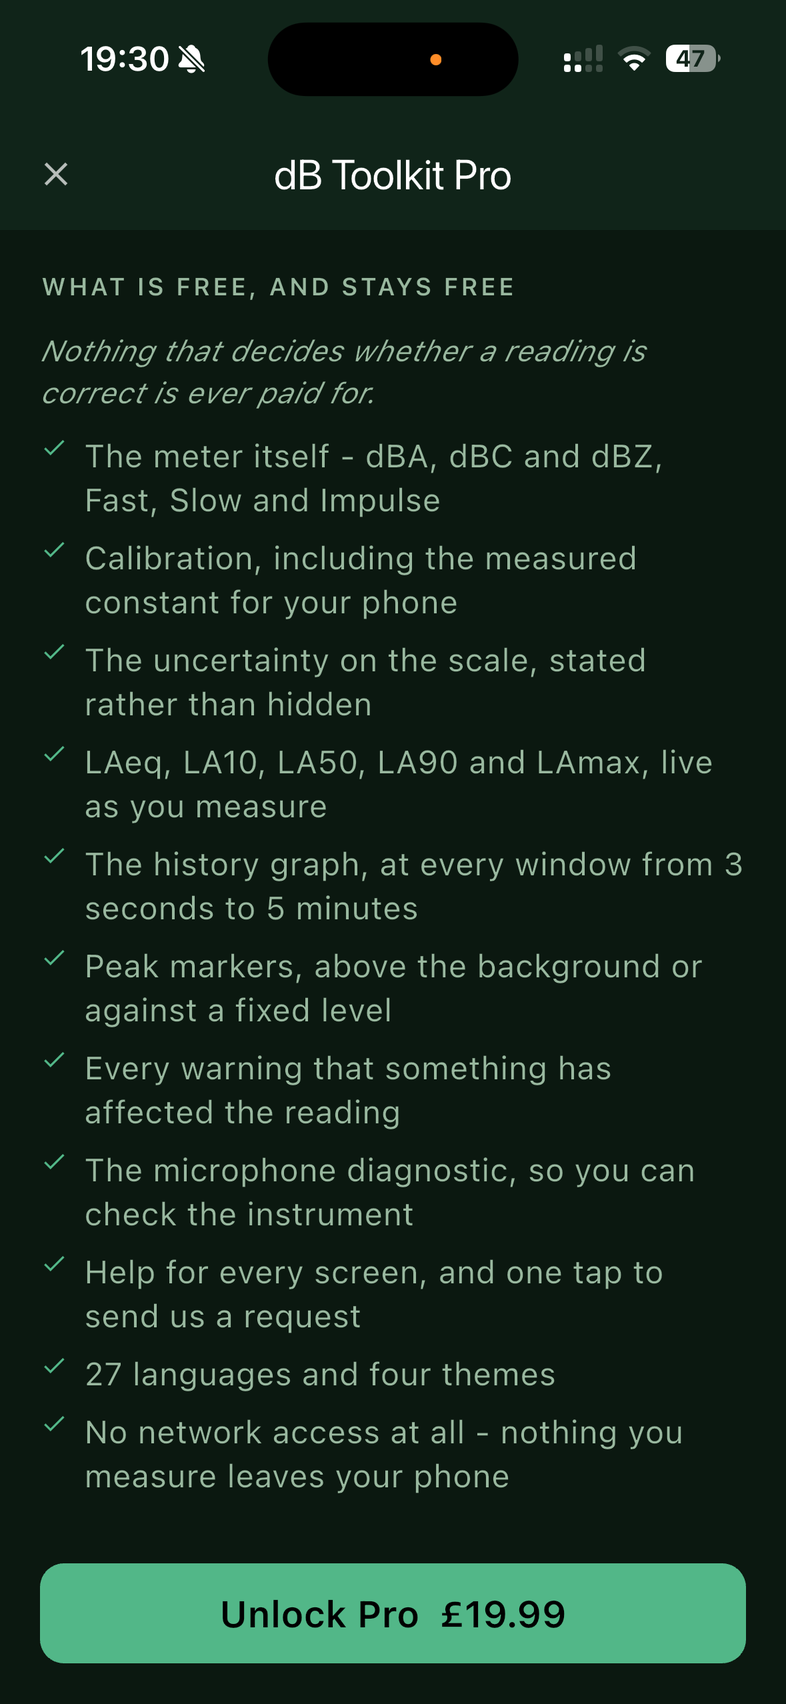
The meter is free and stays free, and it is a complete instrument: the live reading, dBA, dBC and dBZ, Fast, Slow and Impulse, the calibrated scale with its uncertainty stated, LAeq, LA10, LA50, LA90 and LAmax, the history graph and the peak markers. That is as much as a hundred-pound handheld meter does, and rather more than most of them admit to about their own accuracy.
Nothing that decides whether a reading is correct is ever paid for. Some apps charge to unlock the A‑weighting curve. A sound level meter without A‑weighting is not a sound level meter.
Pro is one payment and adds everything a handheld cannot do: recording a session with its audio, the saved history with playback and trimming, the PDF report and CSV export, measuring against a published limit, the noise dose, the spectrum analyser, octave bands, the spectrogram, the signal generator, room measurement, and support for a calibrated USB measurement microphone.
A verdict with three answers, not two
A phone measures on a scale that carries a stated uncertainty — three decibels on the one iPhone measured against a reference microphone, five on every other, and the app says which you have. Against an 85 dB limit that makes any reading between roughly 82 and 88 genuinely undecidable, or 80 and 90 on an estimated scale — and a workplace at 86 dB is exactly the case somebody needs an answer about.
So the app answers pass, fail, or too close to call. The third one is not a hedge. A confident tick there would be a made-up certainty in a document you might act on.
Fully offline
No account, no analytics, no advertising, no server. The app makes no network requests at all. Your recordings never leave your device unless you share them yourself.
One payment, no subscription, and no ads — an app that plays advertising audio while measuring is contaminating its own reading, which is the whole reason this one exists.
What it is not
This is a phone, not a Class 1 or Class 2 sound level meter. For a measurement that has to stand up on its own in court or in a formal enforcement action, you need a calibrated instrument and somebody qualified to use it.
What this gives you is a competent, honest, timestamped record with its uncertainty stated — which is very often the thing that is actually missing when somebody is trying to get a noise problem taken seriously.
Getting it
dB Toolkit is live on the App Store now — tap the badge below to get it. An Android version is planned but not started, so it has no date.

 Coming soon
iPhone, iOS 16 and later. Free to install, with one optional Pro unlock and no subscription. Nothing in the app needs an internet connection, including the report.